
California has about 2.5 million children between the ages of zero and five. More than 20 percent of these children live in poverty.[note]KidsData.org. Children in Poverty – Supplemental Poverty Measure. KidsData.org. Published 2017.[/note] Young children are especially vulnerable to the negative impacts of food insecurity: poor nutrition affects a young child’s ability to learn and grow.[note]Maggi, S, Irwin, LJ, Siddiqi, A, & Hertzman, C. The social determinants of early child development: An overview. Journal of Pediatrics and Child Health. 2010;46: 627–635.[/note] The Child and Adult Care Food Program (CACFP) provides an opportunity to combat food insecurity, boost the nutritional quality of foods being served in the early care setting, and contribute to the financial stability of early care workers and families. However, while California disinvested and neglected the early care and education field over the past decade, children, families, and early care workers lost access to the benefits of CACFP. California’s access and participation trends for CACFP in early care and education settings are reported and discussed below.
The Child and Adult Care Food Program is an important, but often unrecognized, component of child care. At its core, it is a nutrition program that provides funding for healthy meals and snacks served to children in early care and other authorized facilities. In addition to making early care programs healthier, more affordable for low-income families, and more financially sustainable for providers, research has shown that CACFP is also linked to improved quality of care.[note]U.S. General Accounting Office, Health, Education and Human Services Division. Child care: Promoting quality in family child care (B-257209, GAO/HEHS-95-36). Published December 1994.[/note] The federally-funded program is operated by the United States Department of Agriculture (USDA), and in California is administered by the state Department of Education (CDE). CDE grants permission to sponsors (qualified, local nonprofit organizations or public entities) to directly oversee CACFP in family child care homes and child care centers that are eligible and qualified to participate in the program. Sponsors help providers claim monetary reimbursement each month from the CACFP while ensuring that participating family child care home providers and centers stay compliant with state and federal rules. While centers can serve as their own sponsor, family child care homes can only access the benefits of CACFP by enrolling in the program through a sponsor.
Since as far back as 1975, California has provided state funding to supplement the meager federal reimbursements for meals and snacks in CACFP. But in 2012, at the height of the recession, Governor Jerry Brown cut $10.1 million from the state budget designated for the supplement, eliminating the reimbursement for most of child care. Today, the only centers and family child care homes that remain eligible for a supplemental meal reimbursement are those sponsored by a public school food authority. Following this damaging budget cut, CACFP centers reported losing an average of $8,270 from their annual budgets and sponsors reported losing an average of $28,500 in operating funds. Many centers and family child care homes dropped out of CACFP entirely as a result of the budget cut. Learn more about the history of this cut and subsequent advocacy.
Child Care Center CACFP Trends
In federal fiscal year (FFY) 2017, approximately 61 million breakfasts and lunches were served in child care centers, more than $315 million in federal reimbursements were received, and just over $1.8 million in state reimbursement were distributed through CACFP. In 2017, 3,633 child care centers, or 33 percent of all licensed centers in the state, were approved to operate CACFP. Below, you will find summaries of statewide data exploring trends in access, enrollment, average daily participation, and meals served in child care centers.
Figure 1. Map depicting the percent of licensed child care centers that operate CACFP in each county in 2017.
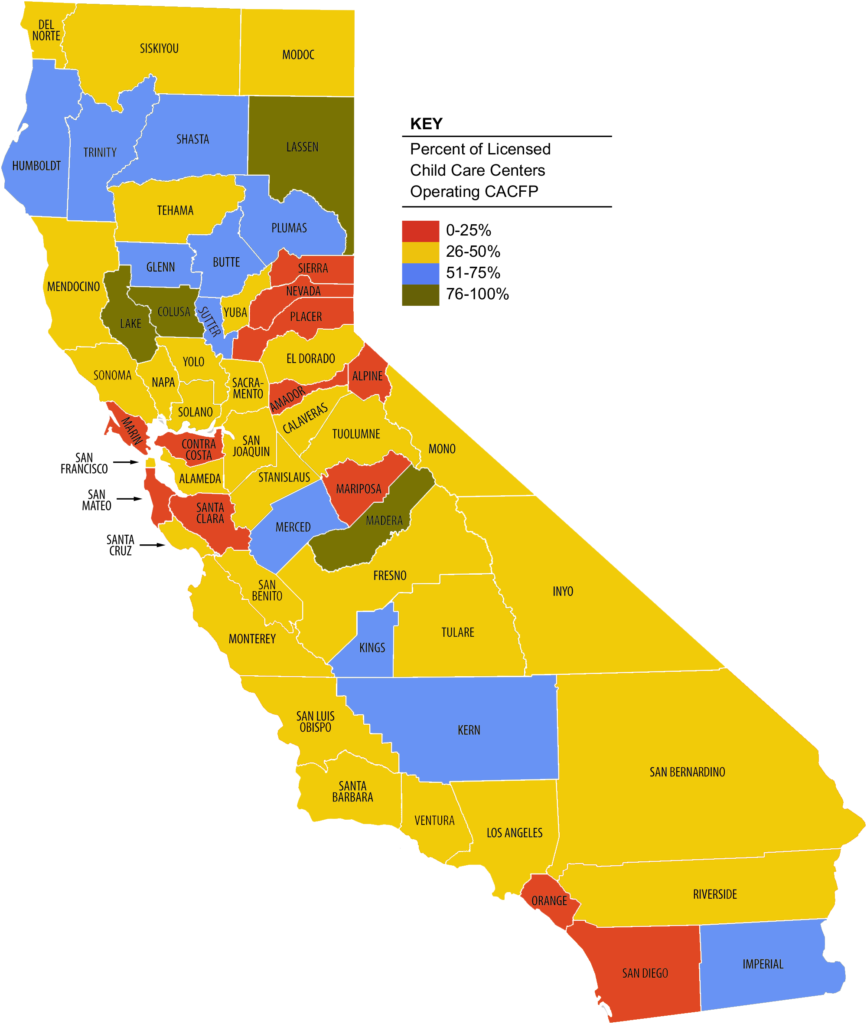
Table 1. Licensed Child Care Centers Approved to Operate CACFP by County in 2017
[table id=7 /]
Source: CFPA analysis of 2017 California Department of Social Services (CDSS) data on licensed child care centers, and 2017 CDE data on licensed child care centers operating CACFP.
Geography determines access to CACFP-approved centers
Just one-third of California’s child care centers, or 3,633 out of 10,860, are approved to operate CACFP. Figure 1 illustrates the disparities between counties with CACFP-approved centers. Three counties (Alpine, Mariposa, and Sierra) do not have any licensed centers approved to operate CACFP, while just four counties have widespread center approval for CACFP (≥76 percent Lake, Madera, Lassen, and Colusa). For Los Angeles and San Diego counties, the state’s two largest child populations, only 43 and 35 percent, respectively, of centers are approved to operate CACFP. As one might expect, in communities where the average household income is higher, such as Marin County, the ratio of CACFP-approved centers tends to be lower, because the program is designed to target regions serving higher concentrations of low-income children. Since 2016, we’ve seen an additional 237 centers join CACFP, while center licensure has declined by a total of 77 centers. One explanation is that centers operating CACFP are more likely to sustain their businesses, perhaps from the additional financial resources CACFP brings.
Fewer CACFP meals being served at child care centers
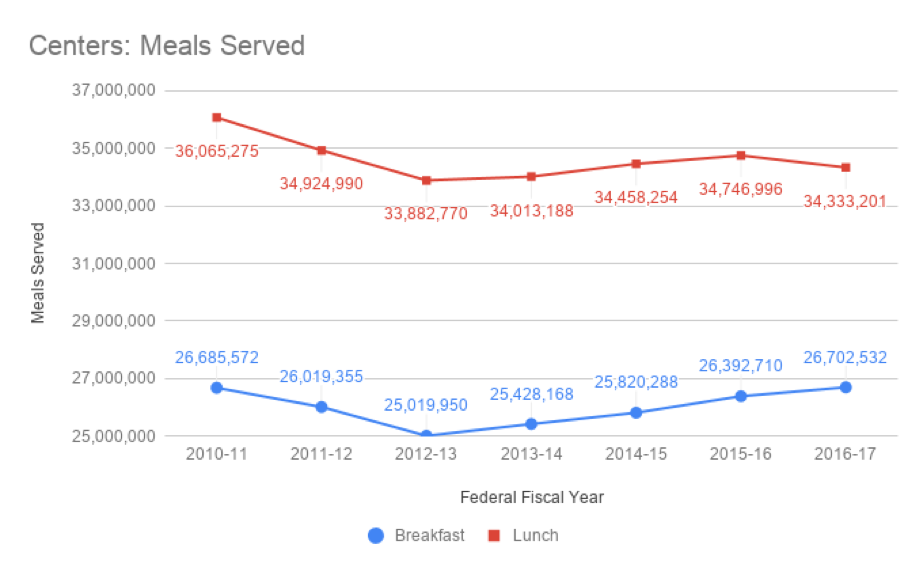
There has been an overall decrease in the number of breakfasts and lunches served – more than 1.7 million fewer meals in FFY 2016-17 than in 2010-11 (see Figure 2). The number of breakfasts and lunches served was lowest in FFY 2012-13 (the same year Governor Jerry Brown eliminated supplemental state funding for CACFP). Access to meals has begun to rise again since FFY 2012-13 but not to 2010 levels.
Figure 2. Total meals served, by breakfast and lunch, in child care centers statewide between 2010 and 2016.
Source: CFPA analysis of FFYs 2010-17 CDE data, provided directly to CFPA.
Between FFYs 2010-12, California cut funding for subsidized care while lowering the income limit for families seeking subsidized care, resulting in severe cuts to available affordable child care slots for working families. As a result, between FFYs 2010-13, there were declines across the numbers of meals and snacks served in centers. The number of breakfasts declined from 26.7 million in FFY 2010-11 to a seven-year low of 25 million in FFY 2012-13; similarly, the number of lunches decreased by approximately 2.2 million during the same time period.
In 2012-13, California created a new Transitional Kindergarten (TK) program that targets four-year-olds born within the last quarter of the year, then dedicated $2.1 billion in state funding to child care development programs in FFY 2013-14. In accordance with significant state investments in child care development programs, the number of meals and snacks served in centers increased steadily between FFYs 2013 and 2016. During this time period, the number of breakfasts served grew by 965,000, and the number of lunches grew by 734,000.
Despite the promise of these recent trends, it is critical to note that the number of breakfasts and lunches served between FFYs 2010 and 2016 still experienced an overall decline of 1.1 and 3.7 percent, respectively. As expected, being the much more economically-responsive meal type, snacks served saw a much greater increase during the same time period, rising further than even 2010-11 levels. These trends are likely attributable to Governor Jerry Brown’s 2012-13 decision to eliminate $10.1 million in CACFP state supplemental reimbursements from the state budget. With less CACFP dollars to purchase and prepare food, centers became much more likely to serve just snacks over meals.
Fewer children are benefitting from CACFP meals
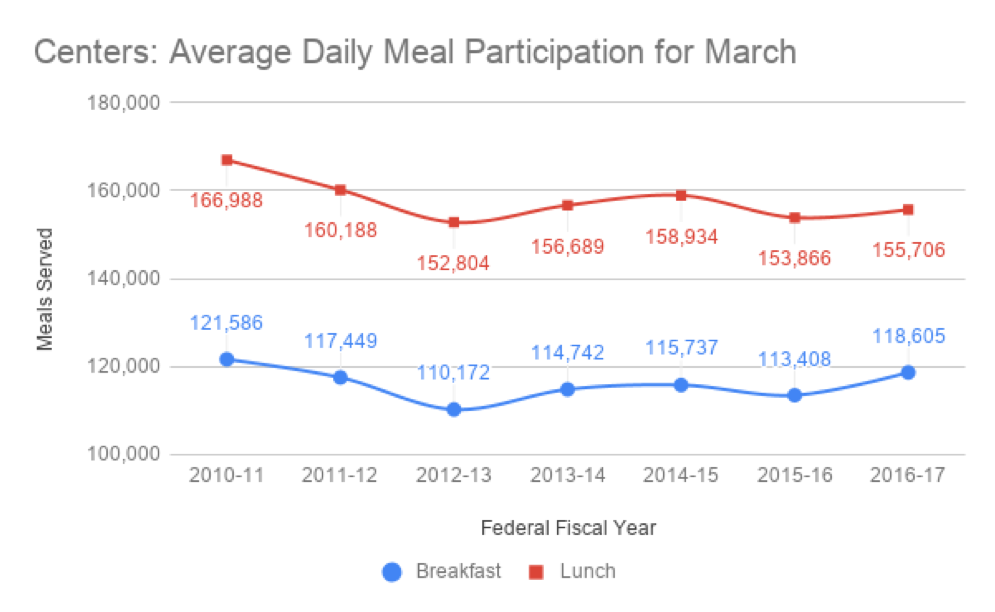
On an average day in California during March 2017, just over 118,000 children participated in breakfast and nearly 156,000 children participated in lunch in CACFP centers (see Figure 3). Compared to FFY 2010-11, there were 14,000+ fewer children participating on an average day in CACFP meals (lunch and breakfast) at child care centers.
Figure 3. Average daily participation by breakfast and lunch in child care centers statewide between 2010 and 2016.
Source: CFPA analysis of FFYs 2010-17 CDE data, provided directly to CFPA.
Trends in average daily participation across meals (excluding supper) and snacks in centers broadly mirror the above trends in meals and snacks served: between FFYs 2010 and 2012, average daily participation experienced sharp declines and reached a seven-year low. Between FFYs 2012 and 2017, average daily participation saw overall increases across all meal types in centers. However, between FFYs 2010 and 2017, while snack participation experienced an overall growth of 5.2 percent, breakfast and lunch participation experienced declines of 2.5 percent and 6.8 percent, respectively – all of which are again attributable to state investments in child care development programs, and concomitant disinvestments in CACFP.
Family Child Care Home CACFP Trends
In FFY 2017, nearly 31 million breakfasts and lunches were served in family child care homes, more than $115 million were received in federal reimbursements, and just over $172,000 in state reimbursements were distributed through CACFP. This same year, 12,987 family child care homes, 47 percent of all licensed family child care homes in the state, were approved to operate CACFP – a loss of a loss of 1,629 sites and down from a 52 percent coverage rate in 2016). In 2017, family child care homes claimed a seven-year low of $115 million in government reimbursements (despite annual COLA adjustments to reimbursement rates), with reimbursements being almost exclusively (99.85 percent) federally funded. Below, you will find summaries of statewide data exploring trends in access, enrollment, average daily participation, and meals served in family child care homes.
Figure 4. Map depicting the percent of licensed family child care homes that operate CACFP in each county in 2017.
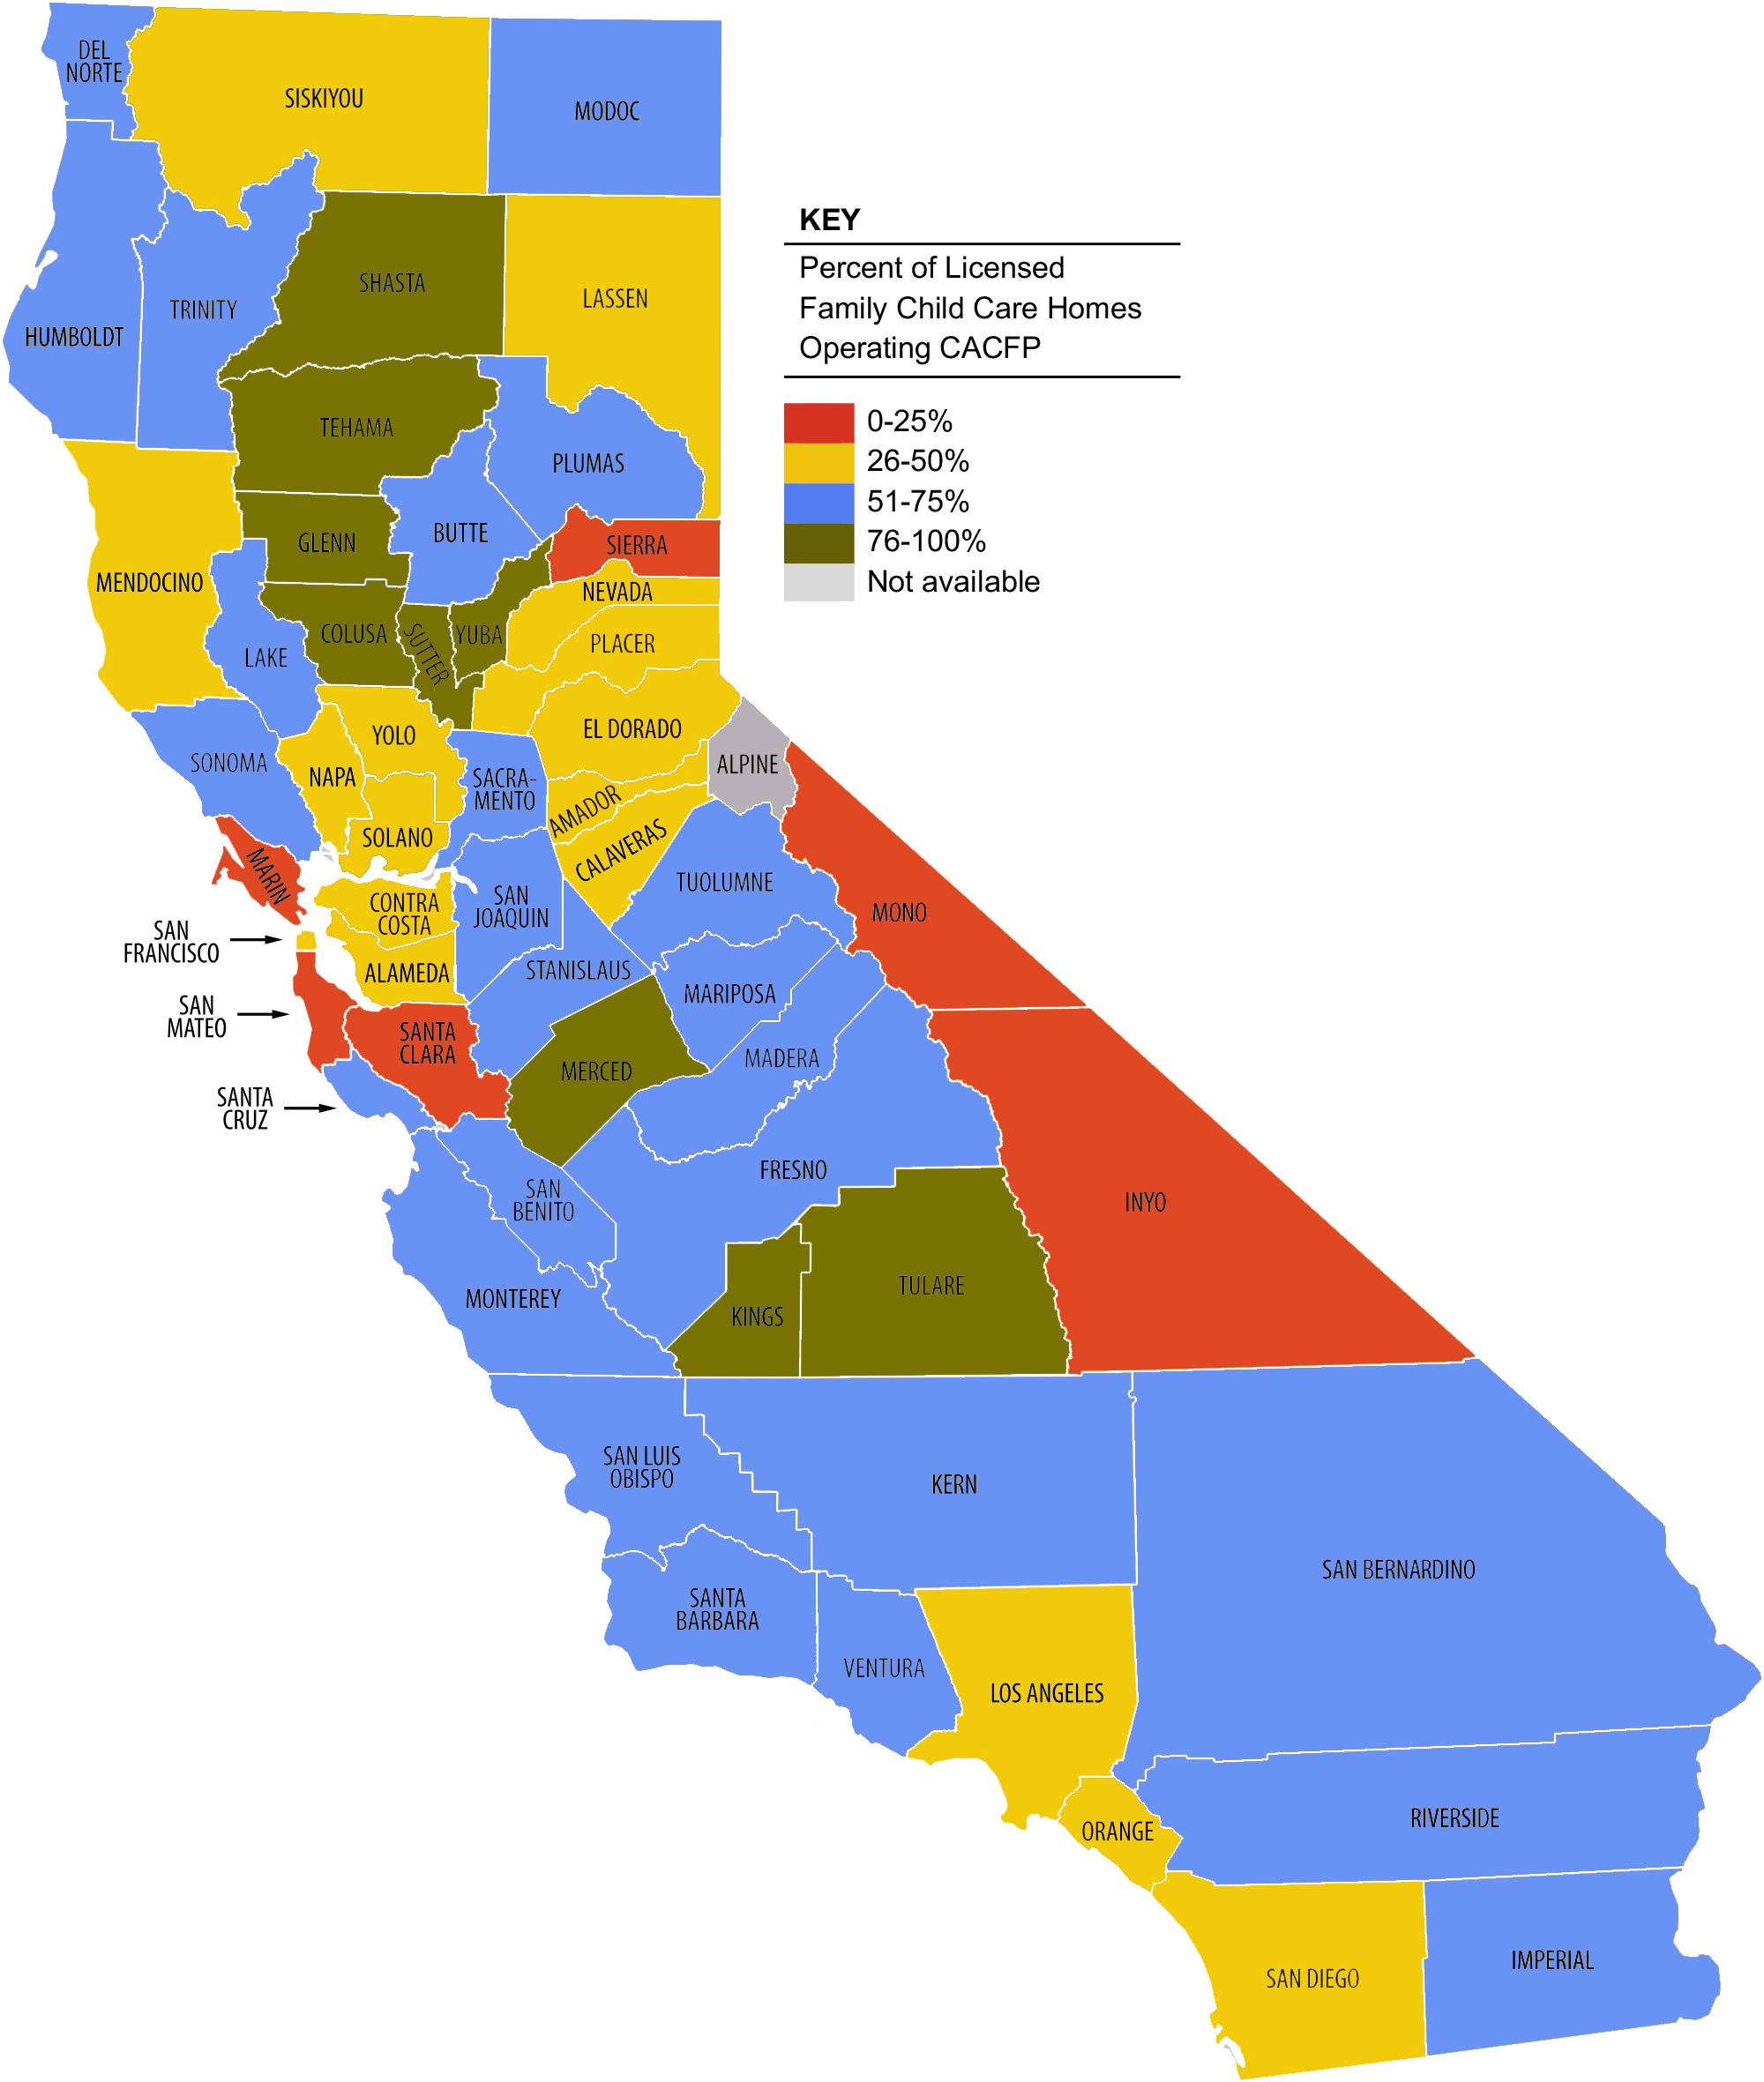
Table 2. Licensed Family Child Care Approved to Operate CACFP by County in 2017
[table id=11 /]
Source: CFPA analysis of 2017 California Child Care Resource & Referral Network data on small and large family child care homes, and 2017 CDE data on licensed family child care homes operating CACFP.
Inequitable access to CACFP family child care homes across the state
In 2017, about 13,000 family child care homes were approved to operate CACFP in California – less than half of all licensed homes. Figure 4 illustrates the great variation among counties. In Fresno, Tulare, and Merced counties, where the percent of children under age 5 living in poverty is the highest, 68 to 83 percent of family child care homes were approved to operate CACFP.[note]United States Census Bureau / American FactFinder. Poverty Status in the Past 12 Months by Age. American Community Survey. U.S. Census Bureau’s American Community Survey Office, Published 2017.[/note] As expected, remote counties with few family child care homes have lower CACFP participation rates. Surprisingly, there are several large and economically diverse counties that have fewer than half of their family child care providers participating in CACFP, including Alameda, Orange, San Diego, Solano, and Los Angeles counties.
Meals and snacks continue to decline with family child care availability
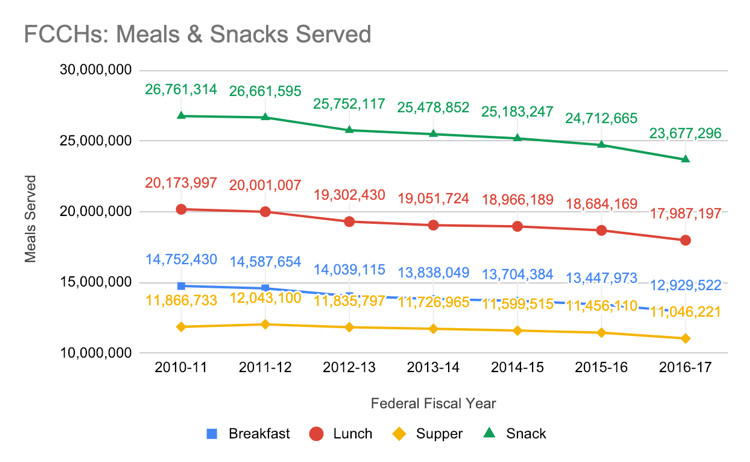
Between FFYs 2014-15 and 2016-17, California lost nearly 29,000 slots in licensed family child care (on top of the nearly 55,000 lost slots between FFYs 2010-11 and 2013-14). At the same time, the number of meals and snacks served in CACFP family child care homes also declined. In 2010, 15 million breakfasts, 20 million lunches, 12 million suppers, and 27 million snacks were served in CACFP family child care homes across California. Seven years later a total of eight million fewer meals and snacks were served, with a loss of nearly 2.7 million meals and snacks in the most recent year (see Figure 5).
Figure 5. Total meals and snacks served in family child care homes statewide between 2010 and 2016.
Source: CFPA analysis of FFYs 2010-17 CDE data, provided directly to CFPA.
Compared to CACFP trends in centers, the trends observed in family child care homes are considerably less varied. In concordance with state and national declines in the number of licensed family child care homes, the number of meals and snacks served also decreased across the board; between FFYs 2010-17, the number of snacks experienced the greatest decrease (more than 3 million), while the number of suppers experienced the smallest decrease (approximately 821,000). Breakfasts and lunches hovered in the middle, with reported losses of 1.8 million and 2.2 million, respectively.
Like centers, the number of meals and snacks served between 2011-13 experienced a great decline, with the number of breakfasts, lunches, and snacks decreasing by more than 3 percent. Worryingly, and very much unlike centers, the steepest decline in meals and snacks served in family child care homes is observed in FFY 2016-17, where all decrease by approximately 4 percent – ranging from 3.6 percent with suppers to 4.2 percent with snacks.
Fewer children at family child care homes are served by CACFP
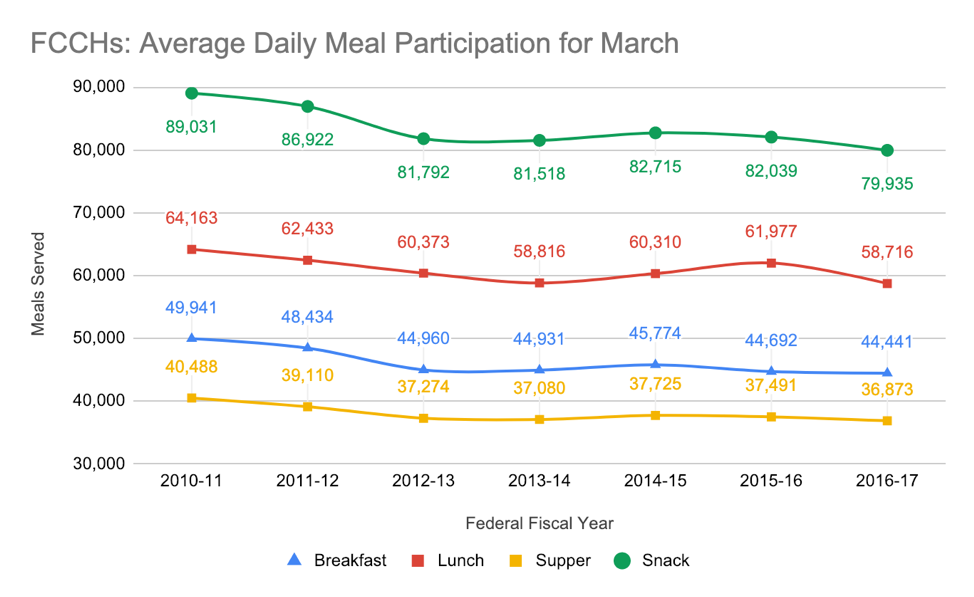
On an average day in California in March 2017, nearly 59,000 children were served lunch, about 44,000 children for breakfast, almost 37,000 children for supper, and just under 80,000 children were served a snack in CACFP family child care homes – this is 23,000+ fewer children participating on an average day across all meals and snacks as compared to 2011. Over the most recent year (between FFY 2015-16 and 2016-17), family child care homes on CACFP served 6,000 fewer children, a three percent decrease (see Figure 6).
Figure 6. Average daily participation in CACFP at family child care homes statewide between 2010 and 2016.
Source: CFPA analysis of FFYs 2010-17 CDE data, provided directly to CFPA.
Unlike the case with centers, trends in average daily participation across meal types in family child care homes do not exactly mirror the above trends in meals and snacks served. While the number of meals and snacks served in family child care homes follow a straightforward trend of decline over time, participation across meal types in family child care homes follow much more nuanced and complex trends. It is unclear why there were slight increases in average daily participation between FFYs 2013-15 and the overall trends should continue to be monitored.
The Role of CACFP in Advancing Equity
CACFP reaches children of color
CACFP primarily serves California’s most marginalized children, including low-income children and children of color. Like other child nutrition programs (including the Special Supplemental Nutrition Program for Women, Infants and Children, or WIC; the National School Lunch Program and the School Breakfast program), CACFP does not collect information about the immigration status of program participants, nor does it exclude participants based on their immigration background. In California, where 1 in 2 Californian children have one or more immigrant parents,[note]Johnson, Hans and Sergio Sanchez. “Just the FACTS: Immigrants in California.” Oakland, CA: Public Policy Institute of California. Published May 2018.[/note] and where immigrant communities are facing new federal threats everyday, it is paramount for CACFP to adopt a perspective of cultural humility and to work with community members and CACFP stakeholders to examine its role in supporting and promoting racial and ethnic equity.
Approximately six in ten children fed by CACFP are children of color. After white children, black and Latinx children are the largest racial/ethnic subgroups reached by CACFP. As children of color throughout our state are much more likely than their white counterparts to live in poverty, the data suggests that CACFP is a promising tool support communities in overcoming racial health disparities that persist.[note]Anderson, Alissa. “If the Poverty Rate for Kids of Color Were as Low as That for White Kids, 977,000 Fewer Kids Would be in Poverty.” Sacramento, California: California Budget and Policy Center. Published April 2018.[/note],[note]Scott, K.,Looby, A.A., Hipp, J.S., and Frost, N. Applying an Equity Lens to the Child Care Setting.The Journal of Law, Medicine & Ethics, 45 S1 (2017): 77-81.[/note]
Racial wage gap in the early care system
For our early care and education workers, CACFP provides much-needed additional dollars into their centers and homes. It helps them keep their jobs, and keep their businesses. When adjusted for the cost of living in California, early care workers are faring among the worst in the nation (ranked 47 out of 51 states, including the District of Columbia).[note]Whitebook, M., McLean, C., Austin, L.J.E., & Edwards, B. (2018). Early Childhood Workforce Index – 2018. Berkeley, CA: Center for the Study of Child Care Employment, University of California, Berkeley, 47. [/note] Further, the median wage of early care workers in California only comprises a little over 60 percent of the state median wage. With limited investments in early care workforce development, CACFP offers one of the few available workforce supports for early care workers.
Wages for early care and education workers are shamefully low, and yet women of color, who make up 40 percent of the workforce, earn 78¢ less (or $1,622.40 less per year for a full-time worker) than their white counterparts.[note]Whitebook, M., McLean, C., Austin, L.J.E., & Edwards, B. (2018). Early Childhood Workforce Index – 2018. Berkeley, CA: Center for the Study of Child Care Employment, University of California, Berkeley.[/note] It’s critically important that culturally responsive support is provided and enrollment barriers are eliminated; California’s CACFP can lead the way in providing equitable opportunity for success in the early care and education field by making sure that the program reaches all those who want and need the support.
Language access & CACFP
In 2016, California was home to approximately 10.7 million foreign-born individuals[note]Sugarman, J. and Geary, C. (August 2018). English Learners in California: Demographics, Outcomes, and State Accountability Policies. Migration Policy Institute.[/note], which accounts for 27 percent of the state population, and 10.5 percent of California children lived in limited English-speaking households.[note]KidsData.org. Children Living in Limited English-Speaking Households (65,000 Residents or More). KidsData.org. Published 2016.[/note] Children whose parents have limited English proficiency (LEP) often face difficult barriers accessing early care and education programs, including limited availability or poorly translated materials; awareness and familiarity of programs and services; and difficulty navigating complex eligibility and enrollment processes. Furthermore, there is an insufficient supply of bilingual and bicultural early care and education providers, particularly for children of backgrounds who speak languages other than Spanish and English.[note]Firgens, E. and Matthews, H. (October 2012). State Child Care Policies for Limited English Proficient Families. CLASP.[/note]
An understanding of these language-related barriers should be applied when assessing the challenges early care providers and families face in accessing and sustaining CACFP. Fortunately, federal and state policies are in place that mandate language access in public programs. Unfortunately, translation of materials and translation services are limited within CACFP, arguably impacting English Learners understanding, ability to successfully navigate, accessibility, and retention of the program.
Policy Recommendations
Invest in Preschool and Early Care Nutrition
Eliminating the state meal reimbursement in 2012 decreased children’s access to the benefits of CACFP and decreased resources for CACFP providers. The state can help family child care home providers and child care centers serve more meals to eligible, low-income children by matching the state supplemental meal reimbursement rate for child care meals with the reimbursement rate for school meals.
Simplify Administration of CACFP
Web-based programs that enable family child care home providers to easily conduct attendance and record meal counts online or on their cell phones has greatly simplified the administration of CACFP. Unfortunately, the reputation of “endless paperwork” is pervasive. While these and other paperwork reduction efforts have made CACFP an easier program to operate, there is still room for improvement. USDA should continue to implement the detailed recommendations of its own Paperwork Reduction Task Force, which would streamline access and simplify monitoring and reporting processes, while continuing to protect program integrity. The CDE should continue to work collaboratively with the Child Care Food Program Roundtable to implement existing flexibilities.
Address Language and Cultural Barriers
California takes great pride in its diversity, but the interaction of language and cultural with CACFP have yet to be explored and understood. The CDE can lead the way by engaging participants, administrative partners, stakeholders, and advocates. First steps should include collecting data on language needs, increasing translation services (e.g., translated materials, bilingual case workers), and adopting a cultural framework to create a more inclusive program.
Acknowledgements
CFPA is indebted to our many partners who join us in the fight to make sure our youngest children, regardless of their background, have access to nutritious meals while in child care. There are so many partners who contributed directly to this report, and who shared their insights from working on and participating in CACFP – without any of whom this report would not have been possible. These partners include but are not limited to the California Department of Education Nutrition Services Division, the California Child Care Resources and Referral Network, and the Child Care Food Program Roundtable. Most notably, CFPA would like to thank Kevin Lee who spent endless hours on this report. We miss you, Kevin!
The Kaiser Permanente Community Benefit Grants Program of Southern California generously funded this report.
Questions?
Contact Melissa Cannon at 209.200.8446.
